Have you ever wanted to reduce the disk space used by an Azure SQL database?
You will quickly find out that the general advice on the Internet is
Don't do it!
. But how bad is it? Read on for a report on how I reclaimed 100s of GB and
saved 2500+ USD from our monthly Azure SQL cost with zero downsides!
For those not familiar to Azure SQL, it's a fully managed "cloud" version of the classical Microsoft SQL Server. There are several different service tiers and options, meaning it's not obvious which model is best. At work, we use an elastic pool, which means several databases share a single pool of resources. The pool itself use the classic DTU model, where you pay for an amount of DTUs which represent compute, storage and IO. Basically, given X DTUs, you get Y disk space. For our case, we use 1500 DTUs, which results in ~1.5TB of disk.
But what if you need more disk? Well, then you just drag the slider in the UI to the next size, which is 2000 DTUs and ~2TB of disk. Its just one tiny little problem, and that is, surprise surprise, the cost. Going from 1500 DTU to 2000 increases the monthly cost with ~2700 USD or ~33% (on the Premium tier).
Often, the data stored in the various databases changes over time, what was once critical data is no longer needed, after the usage has grown it's no longer a good idea to keep all historical data in the main database etc. Same thing happened at my work at MAJORITY.
We got close to the 1.5TB allocated disk limit. The quickest fix would be to just scale up to the next disk size. This is a great advantage of cloud hosting, especially when you're a growing startup where everyone has a ton of important stuff to work on! But as noted above it does not come for free.
We will look at 3 databases, Reporting, Risk and User. These are the DBs in the elastic pool with the most free/unused space. Their table designs and usage are quite different, so any (negative) effects from shrinking should show in at least one of them. The reporting DB only contains a few tables and has data inserted into those continuously, but the big read queries happens only once per day. User DB has lots of tables with many different types of queries. And finally risk DB, which is somewhat in the middle. It has only a few tables, and mainly does key lookup/insert/updates. Another important consideration is that reporting is not as critical as the other ones, and some slower queries won't matter much.
Before shrink, the data used, allocated and allocated but not used looked like this:
| DB | Used (GB) | Allocated (GB) | Unused (GB) |
|---|---|---|---|
| Reporting | 24 | 238 | 214 |
| Risk | 44 | 116 | 72 |
| User | 180 | 353 | 173 |
| total | 248 | 707 | 459 |
In total 459GB or 65% of the disk space not used but still allocated!
As a modern developer, the first thing to reach for is support by AI! Or... actually this is a lie. I didn't ask the AI first, only now when I wrote the article because I was curious what it would answer.
I have a big SQL Elastic cluster in azure. It has 1.4TB of allocated disk with a limit of 1.5TB. But it only uses 900GB. How can I get the allocated unused space back?
I sent the question to GPT-4o through Github. And the answer?
Unfortunately, there isn't a supported "shrink" operation that will return that unused allocated space to the system.
As anyone that have asked ChatGPT/Copilot for anything know, this was of course not the full response, but the key part of it. I don't know why ChatGPT is so useless when it comes to DB questions, this is not the first time.
There are several ways to shrink a database. For this experiment I tried with
DBCC SHRINKFILE
first, but quickly switch to
AUTO_SHRINK
instead. DBCC SHRINKFILE did its job decently, but was very
resource hungry while running. Like many other B2E systems these DBs has
periods of higher load and periods of lower load, but never no load. Therefor
you will need to be somewhat careful with these kinds of maintenance
operations. AUTO_SHRINK can be enabled in this way:
ALTER DATABASE {name of db} SET AUTO_SHRINK ON;
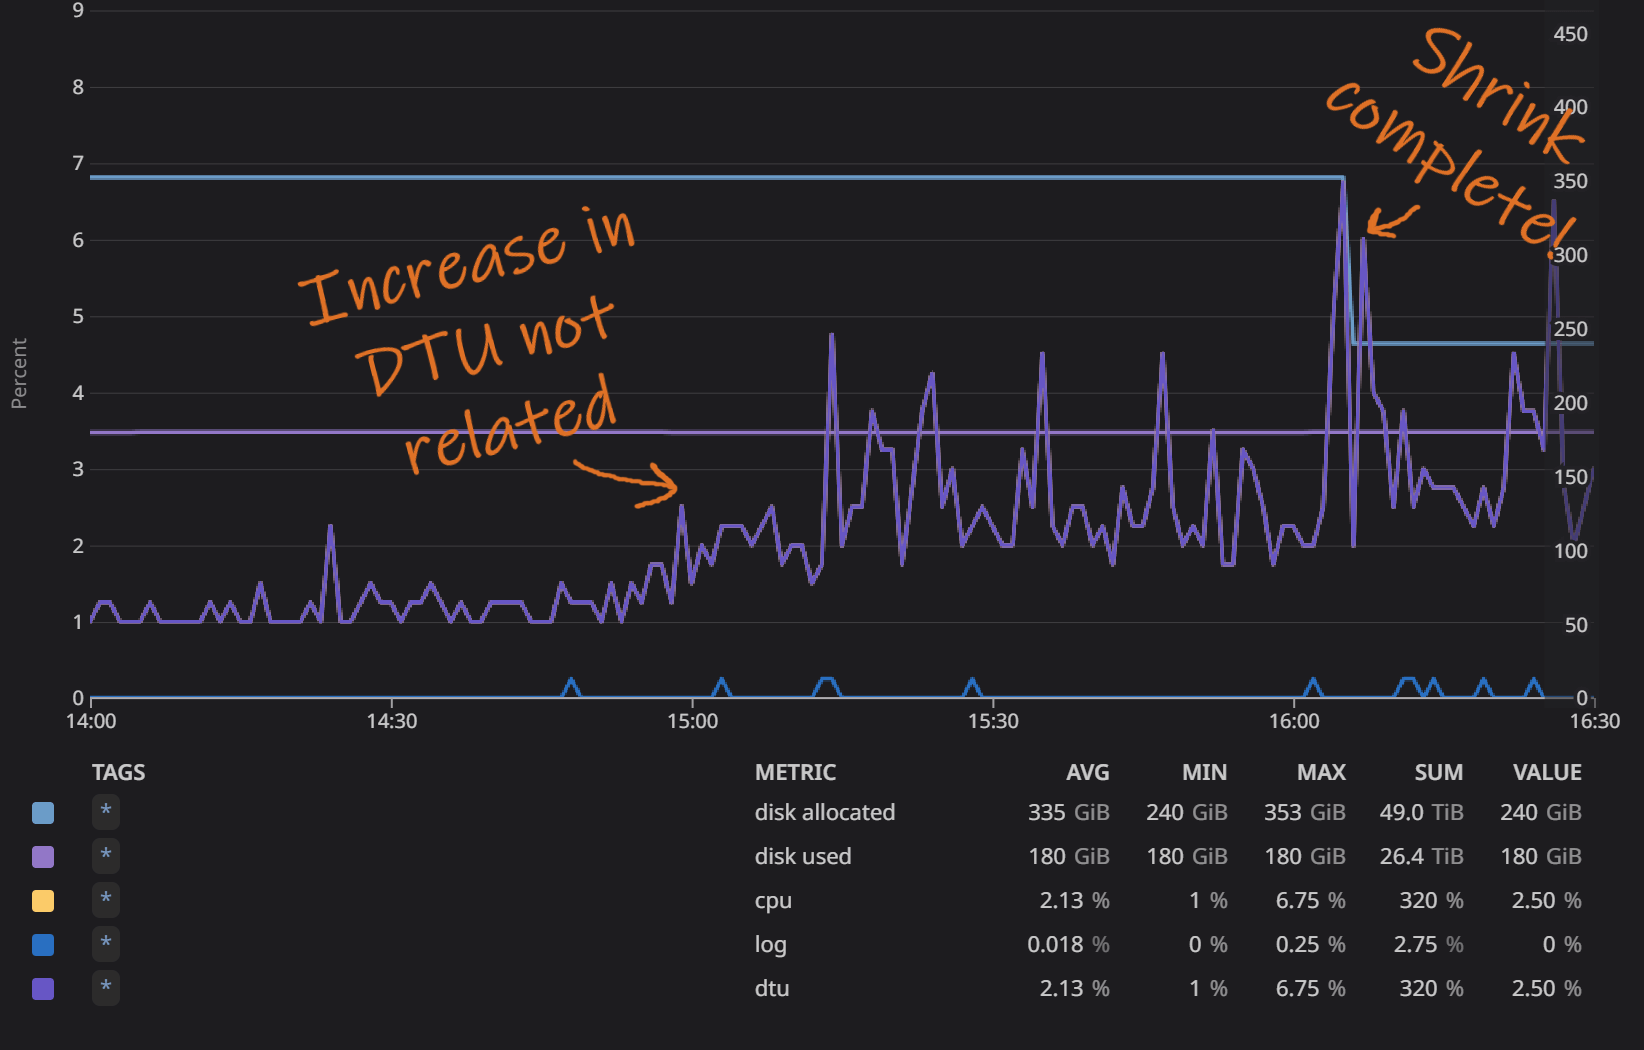
All 3 databases behaved similarly, so its enough to look at one of them. I picked out User DB since its the one with the most load and also the biggest. First lets take a look at the general database stats (disk, DTU, CPU and log usage) in this graph from Datadog:
In the above graph we can see when AUTO_SHRINK completed, that's
when the big drop in allocated disk space happened. Looking at the DTU, the
squiggly line, there is an increase. However, it is not related to the
shrinking but is the database's normal pattern. The "peak" hours start at
around 15:00 and happens at the same time every day regardless of shrinking.
Normally you should not run DB maintenance when it's the most traffic, but in
this case I knew from the other two databases that the effect would be very
low and was curious how it behaved when the DB was under more pressure.
Next, lets look at the actual queries, did their performance change? To check this I measured the median and 99th percentile of all queries ran against the DB:
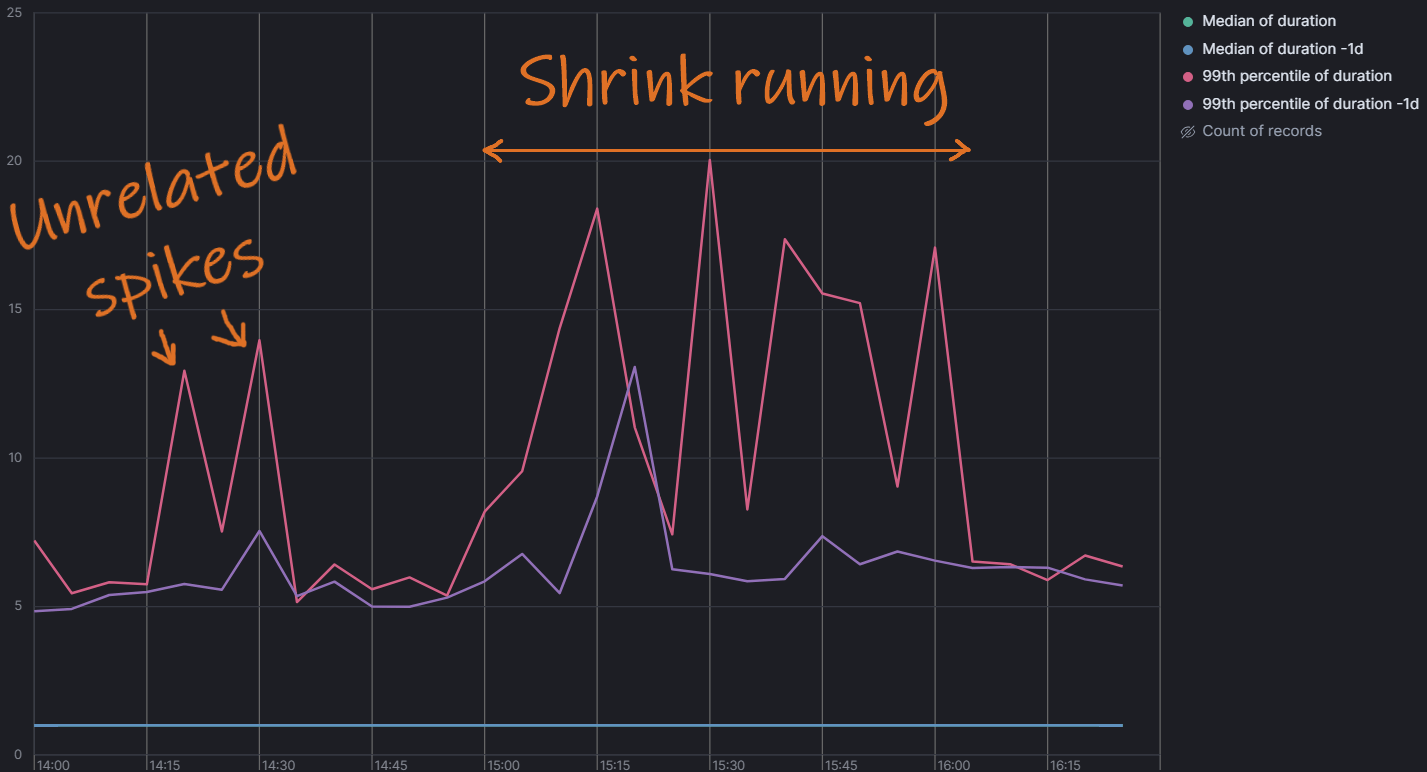
Finally! Here we see something! Let me first explain what this graph measures. Every time a service queries the database it will log the time taken from the service's point of view. The resolution is 1ms. The above graph shows the median and 99th percentile and the same but for the previous day. In the above graph there's a clear increase in the 99th percentile. It more or less tripled, which in one way is a significant increase! However, in absolute numbers its "only" 10-15ms extra in query time, and only for the 99th percentile. In our case this won't be noticed by anyone but be drowned out by other inefficiencies. I.e. if an API call results in 10 DB calls of 1ms each, and 1 external call of 200ms, and 1 of the DB calls becomes 10ms slower, it will only be a ~5% time increase of that API call.
But... What about fragmentation everyone warns about?!
I didn't check very carefully. My high level view is that if the fragmentation does not affect the observable performance, then it doesn't matter. These databases mostly uses random GUIDs as primary keys / cluster keys, which leads to a natural state of fairly heavy fragmentation (with the upside that there's no need for regular REORGANIZE/REBUILD maintenance operations).
I have previously done experiments on our most heavily used DB, by running
REBUILD on all its big tables and indexes. But at that time I
couldn't detect any significant improvement on performance seen from the
backend services. The same happened this time, any additional fragmentation
caused by the shrink operation did not have any visible effect on query times,
even when looking at a longer time period (e.g. several days). Maybe this
observation would be a good topic for another post?
Ok, we have concluded that the impact of DB performance were minimal while the shrink operation ran. But did it give any disk savings?
This is the resulting space used of the DBs after shrink, and the savings compared to before:
| DB | Used (GB) | Allocated (GB) | Unused (GB) | Saved (GB) |
|---|---|---|---|---|
| Reporting | 24 | 31 | 7 | 207 |
| Risk | 44 | 58 | 14 | 58 |
| User | 180 | 240 | 60 | 113 |
| total | 248 | 329 | 81 | 378 |
The shrink reduced the unused space from 459GB to 81GB, in total a reduction of 378GB!
With this massive disk usage saving we could scale down (or rather avoid scaling up to the next tier), and thereby save ~2700 USD in DB hosting costs.
I find it a bit strange that this useful command is not spread more widely. As shown above, given our very standard DBs I could only see a minor degrade of 99th percentile while running the shrink itself, and otherwise only upside of 100s of GB reclaimed for very low effort.
I would still recommend you keep AUTO_SHRINK off by default. This
is to prevent it from running during a critical moment and to not end up in a
shrink/expand/shrink cycle, for example if a table is filled each day and then
emptied during the night. However, I won't hesitate to enable it the next time
there's 100s of GB that could be reclaimed.